
Kurtosis
Kurtosis: Measuring the "Peakedness" of a Distribution
Kurtosis is a statistical measure that describes the shape of a distribution's tails and its peak. Specifically, it assesses the degree of "peakedness" or the extent to which a distribution deviates from a normal distribution in terms of the concentration of data around the mean and the presence of extreme values (outliers). High kurtosis indicates heavy tails or a higher likelihood of extreme values, while low kurtosis suggests lighter tails and fewer extreme observations.
Types of Kurtosis
Leptokurtic:
A distribution with positive kurtosis (greater than 3). It has a higher peak than a normal distribution, with heavier tails. This means that the distribution has a higher probability of extreme values or outliers.
Example: The t-distribution with low degrees of freedom has leptokurtic characteristics.
Mesokurtic:
A distribution with kurtosis equal to 3. This is the kurtosis of a normal distribution, meaning it has a moderate peak and tails that are not too heavy or too light.
Example: The normal distribution itself.
Platykurtic:
A distribution with negative kurtosis (less than 3). It has a flatter peak and lighter tails than a normal distribution, indicating fewer extreme values or outliers.
Example: The uniform distribution is platykurtic.
How Kurtosis is Calculated
Kurtosis is typically calculated using the formula for the fourth central moment of a distribution:
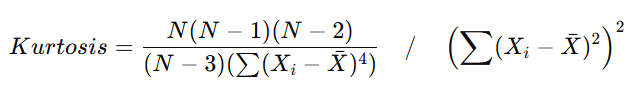
Where:
N is the number of data points in the sample.
Xi is each individual data point.
Xˉ is the mean of the data set.
However, in practice, excess kurtosis is often used, which adjusts the kurtosis value by subtracting 3, so that a normal distribution has an excess kurtosis of 0. Excess kurtosis is calculated as:
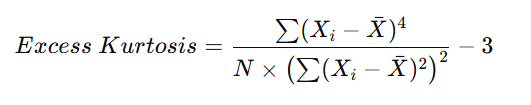
This adjustment makes the normal distribution's kurtosis value equal to 0, simplifying interpretation.
Interpretation of Kurtosis
High Kurtosis (Leptokurtic):
A high kurtosis value (greater than 3 or greater than 0 for excess kurtosis) indicates that the distribution has fat tails and a sharp peak. This suggests that the data has a higher likelihood of extreme values, which might be indicative of volatility or risk in financial contexts.
In finance, high kurtosis can be associated with asset returns that are more likely to experience extreme price changes, like sudden jumps in stock prices.
Normal Kurtosis (Mesokurtic):
A kurtosis value around 3 (or 0 for excess kurtosis) indicates a distribution that follows the shape of a normal distribution. In this case, the likelihood of extreme values is in line with what would be expected from a standard normal distribution.
Many statistical models and financial assumptions rely on the normal distribution, which has a kurtosis of 3.
Low Kurtosis (Platykurtic):
A low kurtosis value (less than 3 or negative excess kurtosis) indicates that the distribution has light tails and a flat peak. This means the data is less likely to produce extreme values or outliers.
Platykurtic distributions are relatively rare in financial markets because most financial returns exhibit higher variability than what platykurtic distributions would suggest.
Practical Applications of Kurtosis
Risk Management in Finance:
In finance, kurtosis is often used to assess the risk of an asset or a portfolio. High kurtosis can indicate greater risk due to the likelihood of extreme events (outliers), such as a market crash or sudden price swings.
Value at Risk (VaR) and other risk metrics often take kurtosis into account when modeling financial returns.
Modeling Financial Data:
Financial returns often exhibit excess kurtosis (greater than 3), indicating a higher likelihood of extreme price movements (market jumps). Therefore, analysts may choose to use distributions with higher kurtosis, such as the Student's t-distribution, to model asset returns more accurately than the normal distribution.
Quality Control and Manufacturing:
In manufacturing or quality control, kurtosis can be used to identify whether a process is prone to producing outlier results (such as defects or extreme product measurements) that fall outside of the expected range. High kurtosis suggests that such outliers are more frequent.
Economic and Social Data Analysis:
Kurtosis can also be useful in analyzing economic or social data to identify unusual concentrations of values, such as spikes in income inequality or extreme economic events like inflation surges or economic recessions.
Kurtosis vs. Skewness
While skewness measures the asymmetry of a distribution, kurtosis focuses on the tailedness and the shape of the distribution.
Skewness tells us whether data is leaning more towards the right (positive skew) or left (negative skew).
Kurtosis, on the other hand, tells us about the presence of outliers and the likelihood of extreme events based on how sharp or flat the distribution is.
For example, a distribution could have zero skewness (symmetric) but a high kurtosis (indicating fat tails and a sharp peak).
Conclusion
Kurtosis is a vital statistical concept used to understand the shape of a distribution, particularly focusing on the presence of extreme values or outliers. By measuring the peakedness and tailedness of a distribution, kurtosis can offer valuable insights, especially in fields such as finance and risk management, where the likelihood of extreme events is a key concern. Understanding the implications of kurtosis helps analysts and decision-makers assess the potential for volatility and extreme outcomes in data, ultimately allowing them to make more informed predictions and risk assessments.